here are the affiliatehq images
Your affiliate software should give you four reports that change what you do on Monday morning: earnings per 100 clicks by affiliate, activation status across your full roster, commission by product, and each affiliate’s traffic trend against their own baseline. Everything else is decoration. If your platform makes you export three CSVs and build a pivot table to see any of those four, the reporting is failing you.
 Affiliate program reports fall into two piles. One pile changes a decision. The other pile makes a nice screenshot for your monthly update to the CEO. Most affiliate reporting software leans hard into the second pile, because total clicks and total revenue are easy to render and they always go up and to the right if you squint.
I’ve run programs from zero to a million dollars a month, and programs doing $325 million a year. The reports I opened every single Monday never changed much across either. Four of them. That’s the whole list. Below is what each one tells you, why your platform probably buries the most useful number in the set, and how to get these reports to show up without anyone building them by hand.
What reports should your affiliate software give you?
Four reports carry the load:
- Earnings per 100 clicks (EPC) by affiliate. Tells you which partners deserve your time this week.
- Activation status across the roster. Tells you how much of your list is dormant and who to wake up.
- Commission by product. Tells you what your affiliates sell well, which tells you who to recruit next.
- Traffic trend by affiliate, measured against that affiliate’s own baseline. Tells you who’s fading before they disappear.
Notice what’s missing. Total program revenue isn’t on the list. Neither is total clicks, total signups, or a pie chart of traffic sources. Those numbers describe your program. They don’t tell you what to do with your next hour. For the wider view of which numbers deserve a weekly look, How To Track Affiliate Performance covers the full review routine.
A good reporting setup answers a question you’d otherwise answer with a guess. Anything that only confirms what you already assumed is a screenshot, not a report.
Picking a platform right now and trying to compare reporting across vendors? I broke down the three main categories of affiliate software and what each one handles well in Best Affiliate Program Software: How to Choose the Right Platform. Read it alongside this post and you’ll know which demo questions to ask.
Why EPC is the number that decides where your time goes
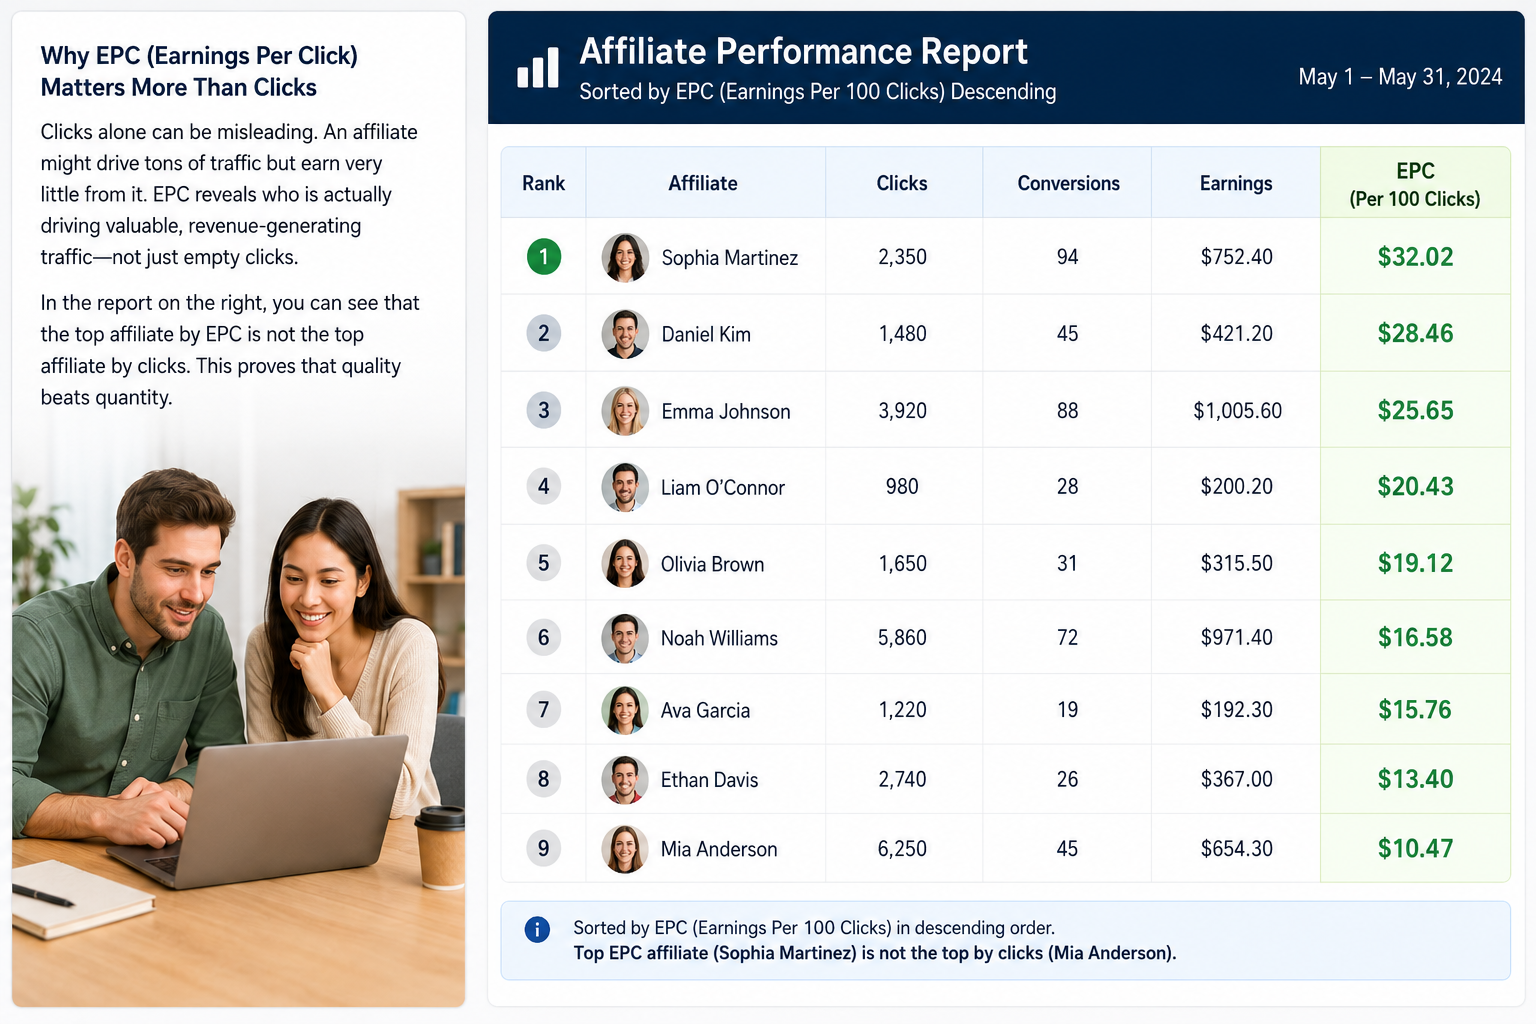
 EPC, or earnings per click, tells you how much commission an affiliate generates for every 100 clicks they send. An affiliate who sends 400 clicks and produces $600 in commissions has an EPC of $150 per 100 clicks. An affiliate who sends 4,000 clicks and produces $800 has an EPC of $20.
Guess which one your total-clicks report crowns as your top affiliate. The one with ten times the traffic and a quarter of the earning power per visitor.
That’s the whole argument for EPC. Raw volume rewards the affiliate with the biggest list. EPC rewards the affiliate whose audience trusts them. Those are different people, and the second group is where your recruiting and your relationship time belong. If you can only see one number about a partner, see that one.
EPC also protects you from a mistake I made for years. I used to spend my week on whoever sent the most traffic, which meant I spent my week on coupon and deal sites while a handful of high-trust partners with modest lists went months without hearing from me. Their EPC was five times higher. Nobody at my company knew, because the dashboard sorted by clicks.
For the mechanics of the calculation and how affiliates use it on their side of the table, read What is EPC in Affiliate Marketing?. For where EPC sits among the rest of your numbers, Affiliate Program KPIs covers the full set.
Why most affiliate platforms bury EPC
Two reasons, and neither one is a conspiracy.
First, EPC requires the platform to join click data and commission data at the affiliate level and then normalize it. Clicks live in one table. Commissions live in another, often with a delay while orders clear refund windows. Joining them correctly takes engineering work that a click counter doesn’t. Plenty of vendors skip it.
Second, the people who built most affiliate software never ran a program for a living. They built what looked like analytics: totals, trends, and a graph. Somebody who has sat in the chair on a Monday morning knows the first question is “who do I email today,” and EPC answers it faster than anything else on the screen.
So you get a platform where EPC lives three clicks deep in a custom report builder, or nowhere at all, and you rebuild it every month in a spreadsheet. I did that for years. It took about 40 minutes a month and I got it wrong twice because I fat-fingered a formula.
In AffiliateHQ, EPC per 100 clicks appears as a column on every report where it makes sense, not as a thing you configure. Sort by it, filter on it, export it. The reason is unglamorous: I built the software after 20 years of running programs, and this was the number I kept rebuilding by hand.
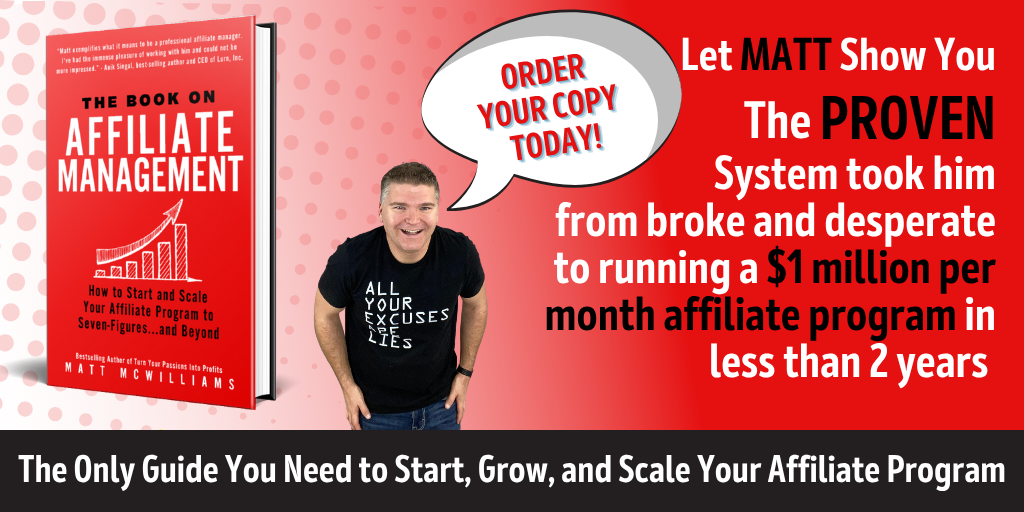
Every feature in AffiliateHQ maps to something I teach in The Book on Affiliate Management, including how to read EPC without over-reacting to a single slow week. The book runs 300+ pages and covers the system I used to build a program to $1 million a month in under two years.
The activation report: how much of your roster is dormant
 Your activation report shows what percentage of your approved affiliates sent at least one click in a given window, usually 30 or 90 days. In most programs I audit, that number sits between 5% and 15%. Owners guess 40%.
The gap between what you think and what’s true is the entire value of this report. You’ve been telling yourself you have 1,200 affiliates. You have 84 affiliates and 1,116 email addresses.
The report needs to do more than give you a percentage. It needs to segment: affiliates who signed up and never sent a click, affiliates who promoted once and stopped, and affiliates who promoted regularly and went quiet in the last 60 days. Those three groups need three different emails. A single “inactive” bucket collapses them into one and you end up sending a generic re-engagement blast that converts at nothing.
The third group is the one to work first. Someone who promoted you four times and then stopped has a reason, and it’s usually something you can fix in a conversation. How To Reactivate Dormant Affiliates walks through the sequence I use.
Once your activation report tells you who went quiet, you need the emails that bring them back. Grab the Affiliate Activation Templates, a free set of emails for getting signed-up affiliates promoting. They solve the exact problem your activation report just put in front of you.
Commission by product and why it changes your recruiting
Commission by product breaks your affiliate revenue down by what got sold, not by who sold it. Sell more than one thing and this report will surprise you within about ten seconds.
A client of mine sold a $47 course and a $997 coaching program. Affiliate revenue split roughly 50/50 in dollars, which looked balanced. Then we ran the report by unit: affiliates moved 340 courses and 16 coaching seats. The coaching sales came from four affiliates, all of whom had personally gone through the program.
That changed the recruiting plan the same afternoon. Instead of chasing more list-holders, we went to the customer base for the coaching program and recruited from there. Sixteen seats became 60 the next quarter.
The report told us something no aggregate revenue number could: our high-ticket product needed a different kind of affiliate, and we already knew where they lived. Pair this report with Affiliate Program ROI if you’re trying to work out which products deserve a higher commission rate.
Traffic trend against each affiliate’s own baseline
 Program-wide traffic trends hide individual collapses. Your total clicks can hold steady all quarter while your third-best affiliate quietly drops 70% and a new signup picks up the slack. You find out four months later when the invoice comes in light.
The fix is a report that compares each affiliate to their own 90-day average rather than to the program or to each other. An affiliate who normally sends 200 clicks a week and drops to 60 is a flag. An affiliate who normally sends 15 and drops to 5 isn’t, even though the percentage is worse.
Set the alert threshold around a 50% drop sustained over two weeks. Tighter than that and you’ll chase noise from vacation weeks and email schedules. Looser and you lose the partner before you notice.
Catching a fade early is one of the least glamorous parts of the job and one of the highest-return, which is why it shows up in What Does an Affiliate Manager Do? as a weekly task rather than a quarterly one. The action here takes four minutes: send a short, non-transactional email. “Noticed things went quiet on your end. Everything okay?” Half the time the answer is a website migration, a health issue, or a competitor who ran a better contest. All three are fixable if you catch them in week two instead of month four.
The reports that look impressive and change nothing
Some reports exist to fill a slide. Know them so you stop spending time on them:
- Total clicks by month. Goes up when you add affiliates. Says nothing about quality.
- Traffic by geography. Interesting once. You will not change a commission rate because 6% of clicks came from Ontario.
- Device breakdown. Your affiliates control their audience’s devices, not you.
- Top affiliates by revenue, with no EPC column. This one is worse than useless because it points your week at the wrong people.
- Real-time click feeds. Fun for about a day. I’ve watched managers lose whole afternoons to this.
One exception on geography: if your fraud numbers look strange, geographic clustering is a real signal. Affiliate Fraud Prevention Tools covers what patterns to watch. Outside of a fraud investigation, leave it alone.
Saved reports, locked filters, and dashboard widgets
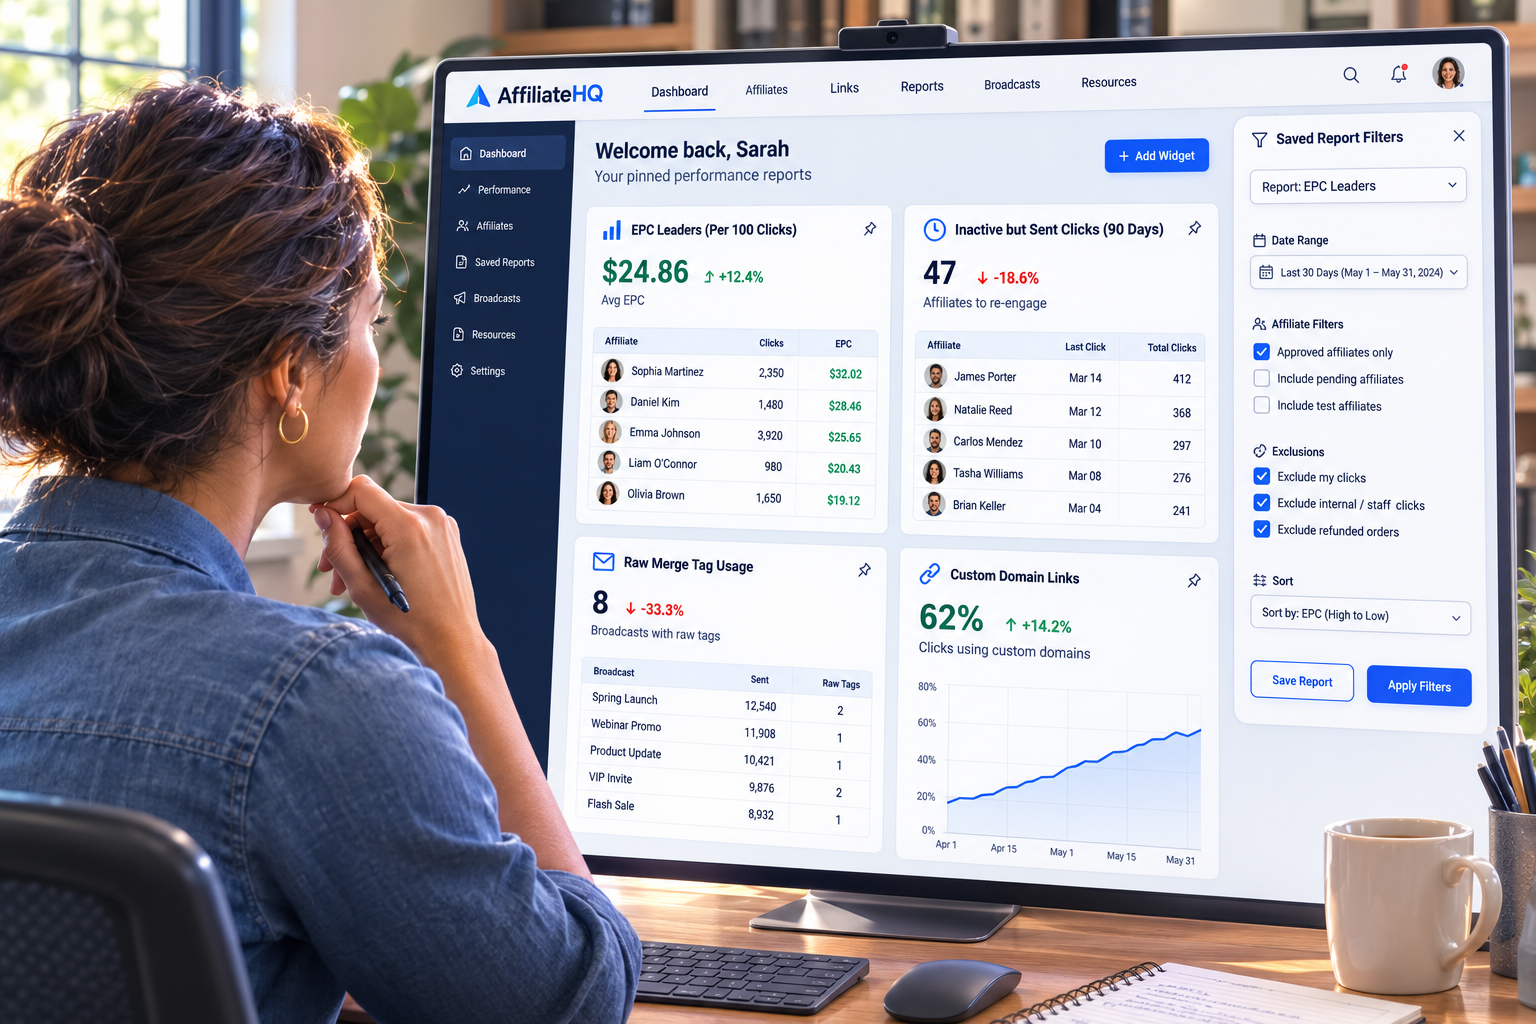 Knowing which reports matter solves half the problem. The other half is getting to them in under five seconds, every week, without rebuilding the filters.
Rebuilding a report is where good intentions die. You decide to check EPC by affiliate every Monday. Week one you set the date range, filter to approved affiliates, exclude the two internal test accounts, sort by EPC. Takes six minutes. Week two, same six minutes. Week five you skip it, and by week nine you’ve stopped looking at EPC entirely.
Saved reports fix this. You configure the filters once and the platform holds them. In AffiliateHQ, a saved report locks its own filters, so opening it next Monday gives you the same view with fresh data. You can pin any saved report to your dashboard as a widget, which means your four decision-driving reports greet you on login instead of waiting behind a report builder.
Build four widgets and stop there. A dashboard with 14 widgets is a wall, and you’ll read none of them.
How to test whether your current reporting is good enough
 Run this test on your platform right now. Give yourself five minutes and a timer.
- Find your top 10 affiliates by EPC over the last 90 days, excluding anyone with fewer than 50 clicks.
- Find the percentage of your approved affiliates who sent at least one click in the last 30 days.
- Find your commission total broken out by product for last month.
- Find any affiliate whose weekly clicks dropped more than 50% against their own 90-day average.
Four answers in five minutes means your reporting works. If you exported anything to a spreadsheet, or if question four sent you hunting for a workaround, your platform is charging you a monthly fee to store data it won’t hand back in a usable shape.
That’s a legitimate reason to change platforms, and a lot of managers don’t treat it as one. They’ll switch for a pricing change and tolerate reporting that costs them four hours a month forever. Reporting quality compounds. Bad reporting means you spend your time on the wrong affiliates, and you won’t know it, because the report that would have told you is the one your software doesn’t produce.
What to do next
Three things, in order:
Run the five-minute test above on your current platform this week and write down which of the four questions you couldn’t answer. That list is your requirements document if you shop for new software.
Build EPC by affiliate for your last 90 days, even if you have to do it by hand this once. Sort it. Compare the top 10 to the affiliates you’ve emailed most in the last month. The overlap is usually smaller than managers expect, and closing that gap is the highest-return thing most programs can do in a quarter.
Pull your activation percentage and segment the dormant group into never-promoted, promoted-once, and recently-gone-quiet. Start your outreach with the third group. They’re the closest to producing revenue again and the least expensive to win back.
Not sure what your numbers are telling you about the program overall? Book a free 20-minute call at Your Affiliate Launch Coach. We’ll review what your reports show and build an action plan for the next 30 to 60 days.
Reports don’t grow an affiliate program. Affiliate managers do, by reading four numbers and then picking up the phone. The software’s only job is to put those four numbers in front of you on Monday morning without making you build them.